RandomGridShuffle
This transformation divides the image into a grid and then permutes these grid cells based on a random mapping.
It could be useful when only micro features are important for the model, and memorizing the global structure could be harmful.
For example: - Identifying the type of cell phone used to take a picture based on micro artifacts generated by phone post-processing algorithms, rather than the semantic features of the photo. See more at https://ieeexplore.ieee.org/abstract/document/8622031 - Identifying stress, glucose, hydration levels based on skin images.
Python
import random
import numpy as np
import cv2
from matplotlib import pyplot as plt

import albumentations as A
Python
def vis_keypoints(image, keypoints, color=KEYPOINT_COLOR, diameter=3):
    image = image.copy()
    for (x, y) in keypoints:
        cv2.circle(image, (int(x), int(y)), diameter, color, -1)
    return image
Python
def visualize(image, mask, keypoints):
    # Create a copy of the image to draw on
    img = image.copy()

    # Apply keypoints if provided
    if keypoints:
        img = vis_keypoints(img, keypoints)

    # Setup plot
    fig, ax = plt.subplots(1, 2, figsize=(10, 5))

    # Show the image with annotations
    ax[0].imshow(img)
    ax[0].axis('off')

    # Show the mask
    ax[1].imshow(mask, cmap='gray')
    ax[1].axis('off')

    plt.tight_layout()
    plt.show()
Python
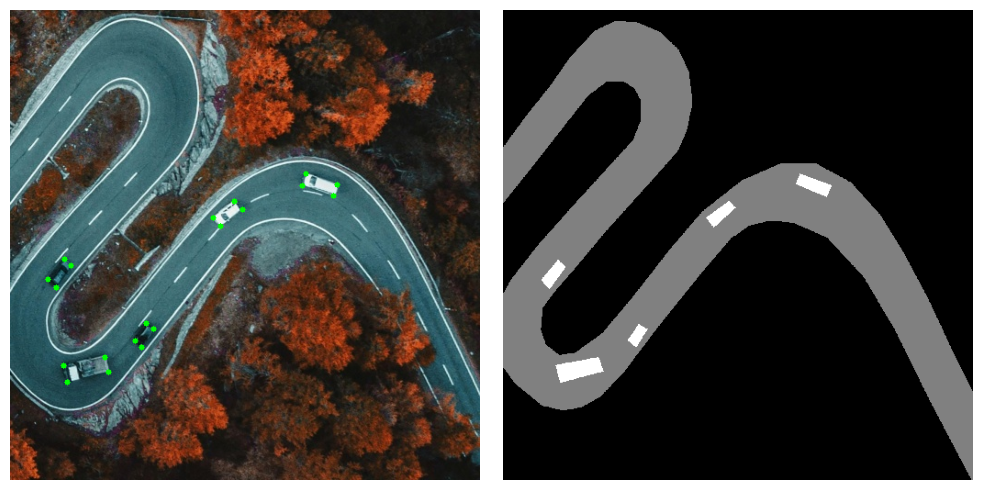
bgr_image = cv2.imread("../data/road.jpeg")
image = cv2.cvtColor(bgr_image, cv2.COLOR_BGR2RGB)

mask = cv2.imread("../data/road.png", 0)
Python
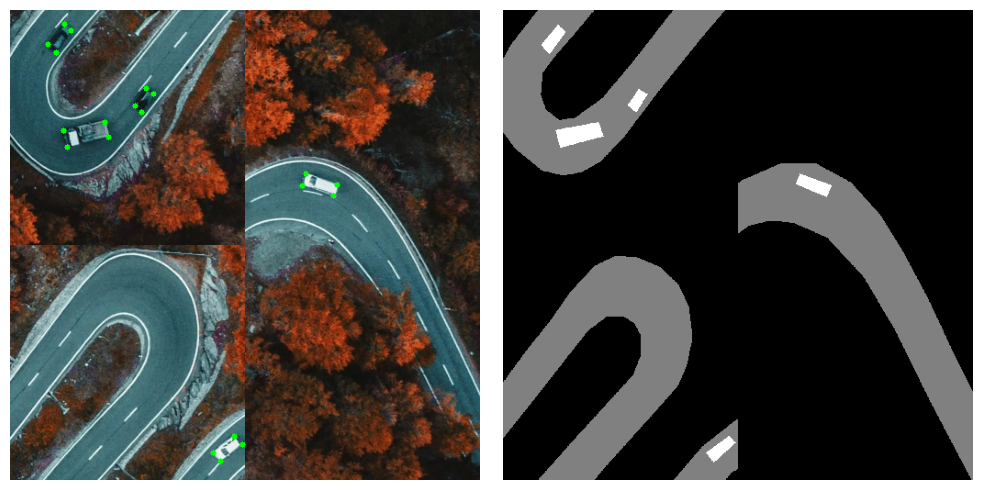
transform = A.Compose([A.RandomGridShuffle(grid=(2, 2), p=1)], keypoint_params=A.KeypointParams(format='xy'))
transformed = transform(image=image, keypoints=keypoints, mask=mask)
visualize(transformed["image"], transformed["mask"], transformed["keypoints"])
Python
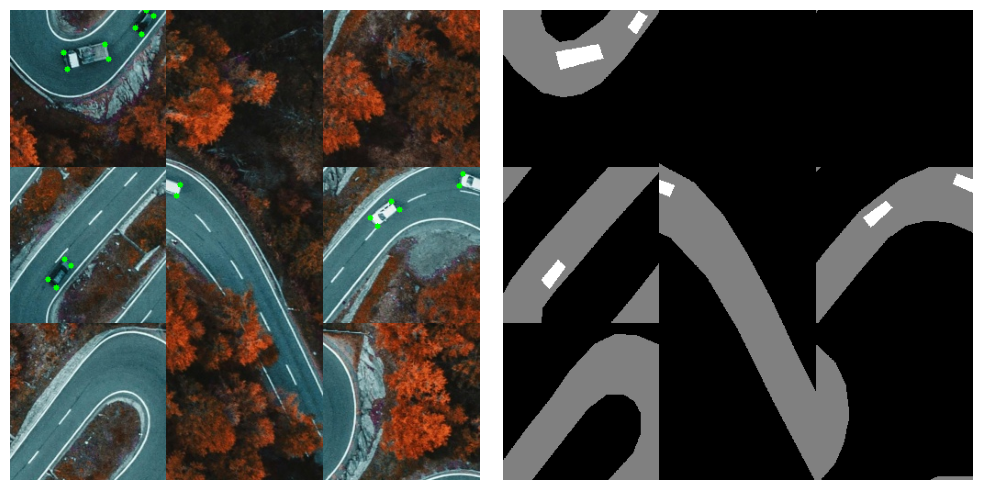
transform = A.Compose([A.RandomGridShuffle(grid=(3, 3), p=1)], keypoint_params=A.KeypointParams(format='xy'))
transformed = transform(image=image, keypoints=keypoints, mask=mask)
visualize(transformed["image"], transformed["mask"], transformed["keypoints"])
Python
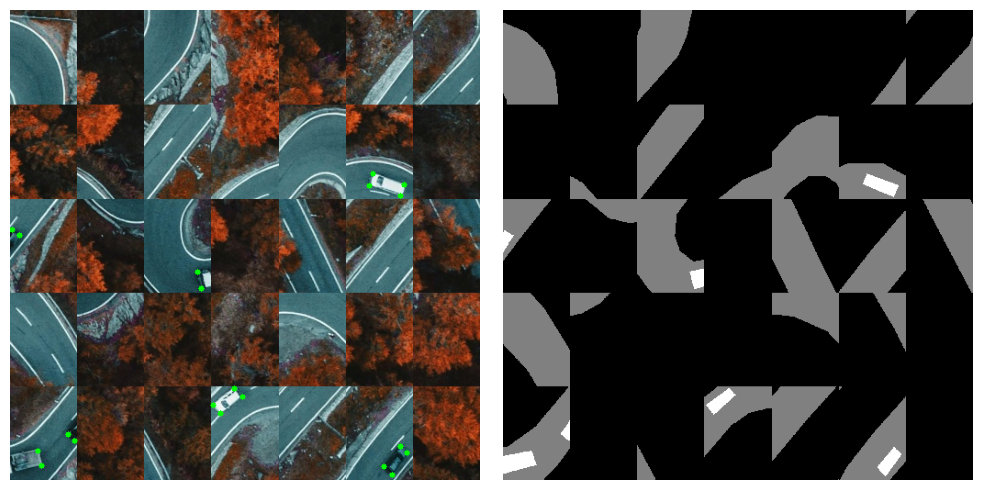
transform = A.Compose([A.RandomGridShuffle(grid=(5, 7), p=1)], keypoint_params=A.KeypointParams(format='xy'))
transformed = transform(image=image, keypoints=keypoints, mask=mask)
visualize(transformed["image"], transformed["mask"], transformed["keypoints"])