D4 transform
Geomatric transforms are the most widely used augmentations. Mainly becase they do not get data outside of the original data distribution and because they "They make intuitive sense".
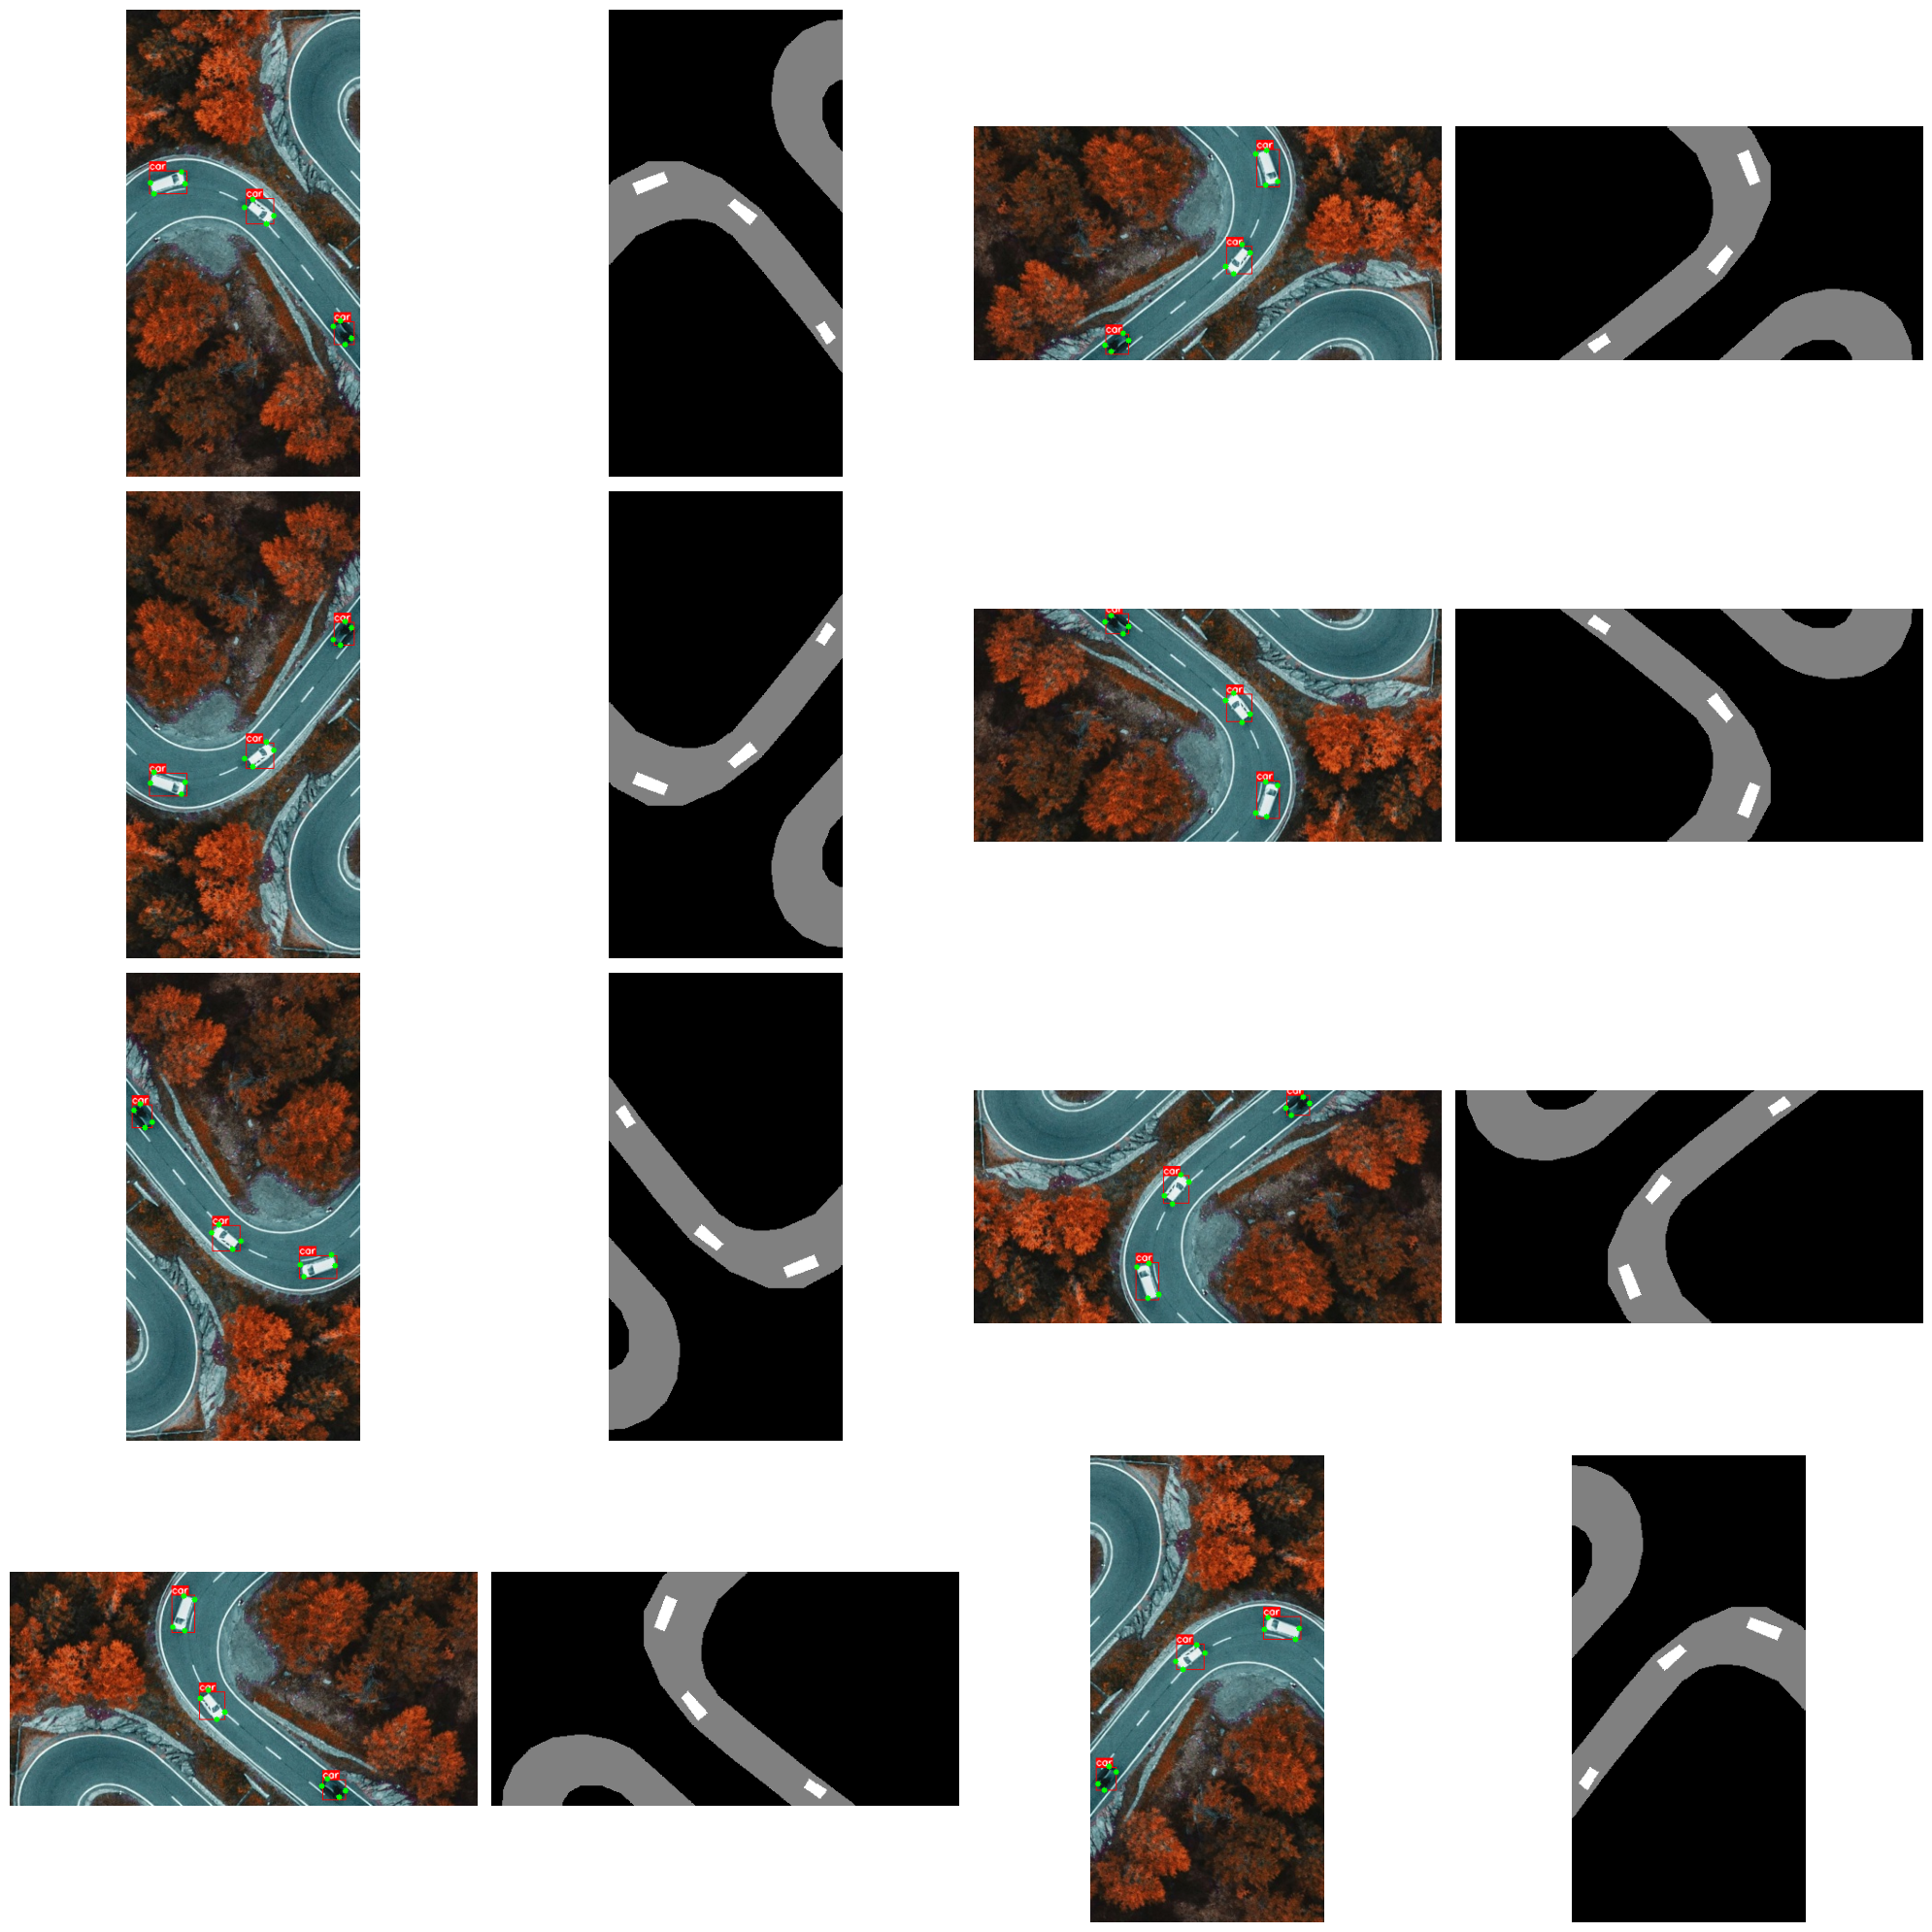
D4 transform maps orignal image to one of 8 states.
e- identity. The original imager90- rotation by 90 degreesr180- rotation by 180 degrees, which is equal tov * h = h * vr270- rotation by 270 degreesv- vertical fliphvt- reflection across anti diagonal, which is equal tot * v * hort * rot180h- horizonal flipt- reflection actoss the diagonal
The same transform could be represented as
Hence this is just a convenient notation.The transform is useful in situations where imagery data does not have preferred orientation:
For example: - medical images - top view drone and satellite imagery
Works for: - image - mask - keypoints - bounding boxes
Python
import random
import numpy as np
import cv2
from matplotlib import pyplot as plt

import albumentations as A
Python
def visualize_bbox(img, bbox, class_name, bbox_color=BOX_COLOR, thickness=1):
    """Visualizes a single bounding box on the image"""
    x_min, y_min, x_max, y_max = (int(x) for x in bbox)
    cv2.rectangle(img, (x_min, y_min), (x_max, y_max), color=bbox_color, thickness=thickness)

    ((text_width, text_height), _) = cv2.getTextSize(class_name, cv2.FONT_HERSHEY_SIMPLEX, 0.35, 1)
    cv2.rectangle(img, (x_min, y_min - int(1.3 * text_height)), (x_min + text_width, y_min), bbox_color, -1)
    cv2.putText(
        img,
        text=class_name,
        org=(x_min, y_min - int(0.3 * text_height)),
        fontFace=cv2.FONT_HERSHEY_SIMPLEX,
        fontScale=0.35,
        color=TEXT_COLOR,
        lineType=cv2.LINE_AA,
    )
    return img

def vis_keypoints(image, keypoints, color=KEYPOINT_COLOR, diameter=3):
    image = image.copy()
    for (x, y) in keypoints:
        cv2.circle(image, (int(x), int(y)), diameter, color, -1)
    return image
Python
def visualize_one(image, bboxes, keypoints, category_ids, category_id_to_name, mask):
    # Create a copy of the image to draw on
    img = image.copy()

    # Apply each bounding box and corresponding category ID
    for bbox, category_id in zip(bboxes, category_ids):
        class_name = category_id_to_name[category_id]
        img = visualize_bbox(img, bbox, class_name)

    # Apply keypoints if provided
    if keypoints:
        img = vis_keypoints(img, keypoints)

    # Setup plot
    fig, ax = plt.subplots(1, 2, figsize=(6, 3))

    # Show the image with annotations
    ax[0].imshow(img)
    ax[0].axis('off')

    # Show the mask
    ax[1].imshow(mask, cmap='gray')
    ax[1].axis('off')

    plt.tight_layout()
    plt.show()
Python
def visualize(images, bboxes_list, keypoints_list, category_ids_list, category_id_to_name, masks):
    if len(images) != 8:
        raise ValueError("This function is specifically designed to handle exactly 8 images.")

    num_rows = 4
    num_cols = 4

    fig, axs = plt.subplots(num_cols, num_rows, figsize=(20, 20))

    for idx, (image, bboxes, keypoints, category_ids, mask) in enumerate(zip(images, bboxes_list, keypoints_list, category_ids_list, masks)):
        img = image.copy()

        # Process each image: draw bounding boxes and keypoints
        for bbox, category_id in zip(bboxes, category_ids):
            class_name = category_id_to_name[category_id]
            img = visualize_bbox(img, bbox, class_name)

        if keypoints:
            img = vis_keypoints(img, keypoints)

        # Calculate subplot indices
        row_index = (idx * 2) // num_rows  # Each pair takes two columns in one row
        col_index_image = (idx * 2) % num_cols  # Image at even index
        col_index_mask = (idx * 2 + 1) % num_cols  # Mask at odd index right after image

        # Plot the processed image
        img_ax = axs[row_index, col_index_image]
        img_ax.imshow(img)
        img_ax.axis('off')

        # Plot the corresponding mask
        mask_ax = axs[row_index, col_index_mask]
        mask_ax.imshow(mask, cmap='gray')
        mask_ax.axis('off')

    plt.tight_layout()
    plt.show()
Python
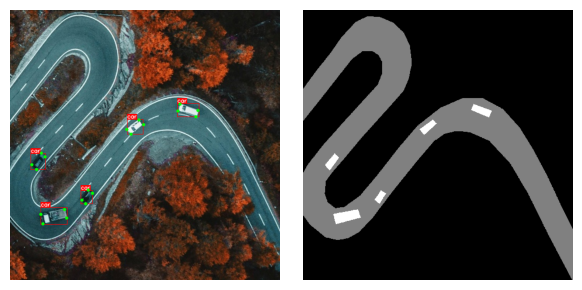
bgr_image = cv2.imread("../data/road.jpeg")
image = cv2.cvtColor(bgr_image, cv2.COLOR_BGR2RGB)

mask = cv2.imread("../data/road.png", 0)
Python
# In this example we use only one class, hence category_ids is list equal to the number of bounding boxes with only one value
category_ids = [1] * len(labels["bboxes"])
category_id_to_name = {1: "car"}
Python
transform = A.Compose([
    A.CenterCrop(height=512, width=256, p=1),
    A.D4(p=1)],
                     bbox_params=A.BboxParams(format='pascal_voc', label_fields=['category_ids']),
                     keypoint_params=A.KeypointParams(format='xy'))
Python
transformed = transform(image=image, bboxes=bboxes, category_ids=category_ids, keypoints=keypoints, mask=mask)
Python
def get_hash(image):
    image_bytes = image.tobytes()
    hash_md5 = hashlib.md5()
    hash_md5.update(image_bytes)
    return hash_md5.hexdigest()
Python
transformations_dict = {}

for _ in range(80):
    transformed = transform(image=image, bboxes=bboxes, category_ids=category_ids, keypoints=keypoints, mask=mask)
    image_hash = get_hash(transformed["image"])

    if image_hash in transformations_dict:
        transformations_dict[image_hash]['count'] += 1
    else:
        transformations_dict[image_hash] = {
            "count": 1,
            "transformed": transformed
        }
The transform generates all 8 possible variants with the same probability, including identity transform
8
7c795aa3b49e3e6ddc8aa88b8733e722 14
c085441d5d9caf2f023ecf00d110128b 11
c714bc2f34652f4602086e7e40ae220d 13
ea0eff187cd3ace9958c4a5816352cd0 8
9ab005fad5fc545fe637d9fa6e8f61a6 11
6f6b1cbc99952ed23a35516925a5f674 5
28b177074878fe87574650377c205697 12
a47ceaaf314a159365c0092867e881e6 6
Python
images = [x["image"] for x in transformed_list]
masks = [x["mask"] for x in transformed_list]
bboxes_list = [x["bboxes"] for x in transformed_list]
keypoints_list = [x["keypoints"] for x in transformed_list]


category_ids_list = [[1] * len(x["bboxes"]) for x in transformed_list]
category_id_to_name = {1: "car"}